Thursday, May 23, 2024

Accumulation Distribution Testing Selling and buying climax


Once the campaign has begun, the price action then follows this typical pattern, where the market is repeatedly moved higher and lower. This type of price action is essential to 'shake' sellers out of the market. We can think of this as shaking fruit from a tree, or as we do in Italy, harvesting the olives! The tree has to be shaken repeatedly in order for all the crop to fall. Some of the crop is more firmly attached and takes effort to release. This is the same in the financial markets. Some holders will refuse to sell, despite this constant whipsaw action, but eventually they give up after several 'false dawns', generally on the point when the campaign is almost over, with the insiders preparing to take the market higher with fully stocked warehouses. So the campaign comes to an end. It is all over, until the next time!


The insiders now have a willing supply of victims to whom they happily sell to in ever increasing numbers, but careful never to sell the market too hard. Prices therefore trade in a narrow range, sucking in more buyers on each dip. Finally, the warehouse is empty, and the campaign comes to an end. Fig 5.11 illustrates the typical price action and volume schematic of the distribution phase


The colour of the body of the candle is unimportant. What is important, is the height of the wick, the repeated nature of this price action, and the associated high volumes. This is sending a clear signal that the market is ready to move fast, and as the warehouses are all empty, the reaction will be quick. The insiders are now jumping on their mats, and heading off down the helter skelter, back to 'square one' to begin the process once again with an accumulation phase. When we see this price action, following a distribution phase, it's best to be in front of your screen – ready and waiting! Now let's look at the opposite of the selling climax, which is the buying climax. This is the firework party that marks the end of the accumulation phase, and signals the start of the bullish trend higher. Fig 5.17


Do we mean the insiders are free to simply move prices higher and lower at random and whenever it suits them to do so. The answer is NO. What I mean by market manipulation, which is perhaps different to other peoples view, is that this simply means using every available resource, to either trigger fear or greed in the retail traders mind. This means using every piece of news in the media to influence the buying and selling, and to move the market in the direction that the insiders require, either higher to a distribution phase, or lower to an accumulation range.



Sunday, May 19, 2024

some entries in cochin potential could have been


Shakeouts


Get low risk setups rather than waiting for obvious lines


Bear Trap/Shakeout = breaks support, and then comes up 


Shakeout and comes up with good volume / gap up 


Prior support is entry point


3-3:15 pm scans


Price shakeout MA shakeout Pyramid - do not be greedy


Undercut and Rally 


45 degree stocks with bounce frmo mas


strong stocks can be traded with 10 mas 


univastu

Pocket Pivot

Pocket Pivot Breakout Indicator


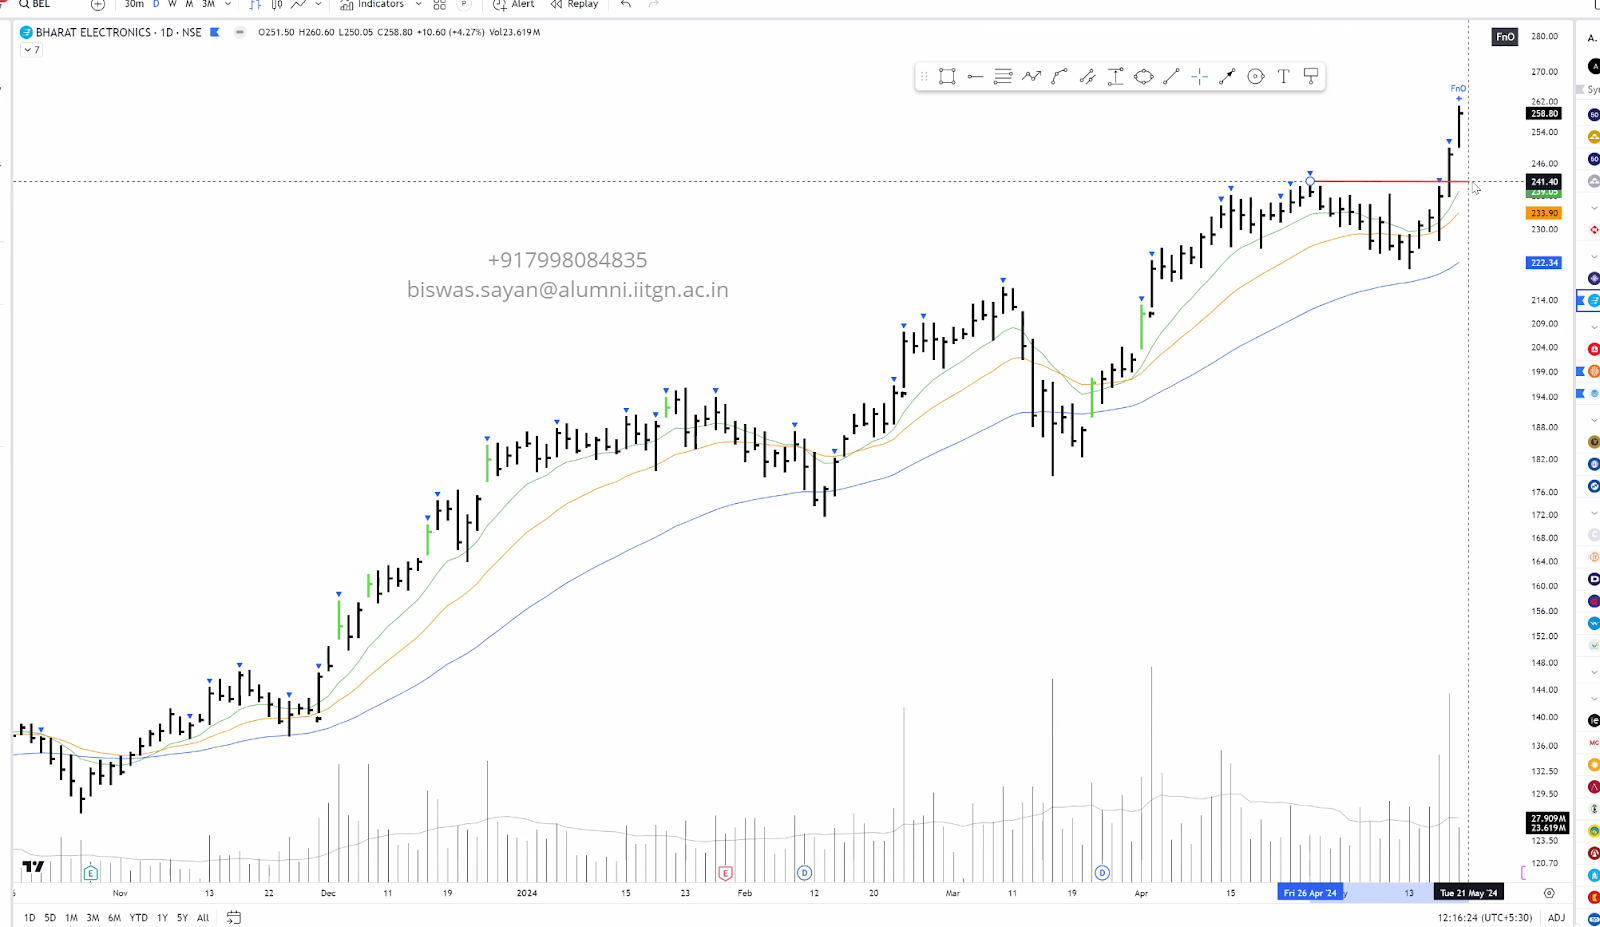
The pocket pivot breakout indicator will show a blue arrow under the candle if both the following conditions are met:
1. The percentage change of the candle on that day from open is greater than 3%.
2. The volume on the day of 3% candle is higher than the highest red volume in the past 10 days.

The second condition is based on the 'Pocket Pivot' concept developed by Gil Morales and ‎Chris Kacher.

If only one of the conditions is met, while the other is not, there will be no arrow.

How to use the Pocket Pivot Breakout indicator?
1. If the stock is breaking out of a proper base like (cup & handle, Darvas box etc.), you can use the blue arrow as an indicator to make your initial buy.
2. If you already own a stock, the blue arrow indicator can be used for pyramiding, following a continuation breakout from a proper base.
3. Avoid making a new entry or continuation entry if the stock is too extended from 10ma.

Gap-up > 0.5% Indicator
Gap-up Indicator displays a blue colored candle when a stock gaps up by more than 0.5% compared to previous day's close.
It is turned off by default. To activate it, check the box next to Gap-up > 0.5% in the indicator options.

How to use the Gap-up Indicator?
1. When a stock gaps up, it usually indicates strength, especially if on the day of the gap-up, the stock closes strongly.
2. This indicator should not be used in isolation but with a proper base breakout from a tight consolidation.
3. If a stock is already extended from 10ma, avoid taking any new or continuation entries.

Precautions
1. Avoid buying longs when the general market conditions are not favorable.
2. Avoid buying stocks below 200ma.
3. Avoid making a new entry or pyramid entry if a stock is too extended from 10ma.

Important Points
1. Always choose fundamentally strong stocks showing strong growth in earnings/margins/sales.
2. Buy these fundamentally strong stocks when they are breaking out of proper bases.
3. To learn more about pocket pivots and buyable gap-ups, read the book, Trade Like an O'Neil Disciple (by Gil Morales & Chris Kacher).

thermodynamics GATE

 THERMODYNAMICS