Two indicators: Price and Volume
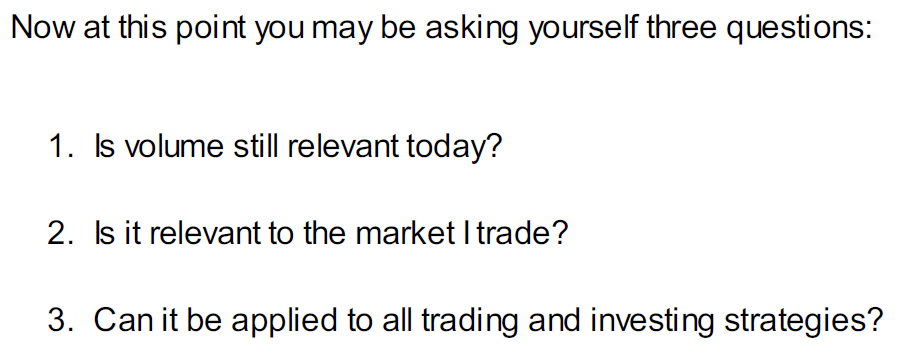
When demand is greater than supply, then prices will rise to meet this demand, and
conversely when supply is greater then demand then prices will fall, with the over supply being absorbed as a result

The story of uncle joe and his widgets

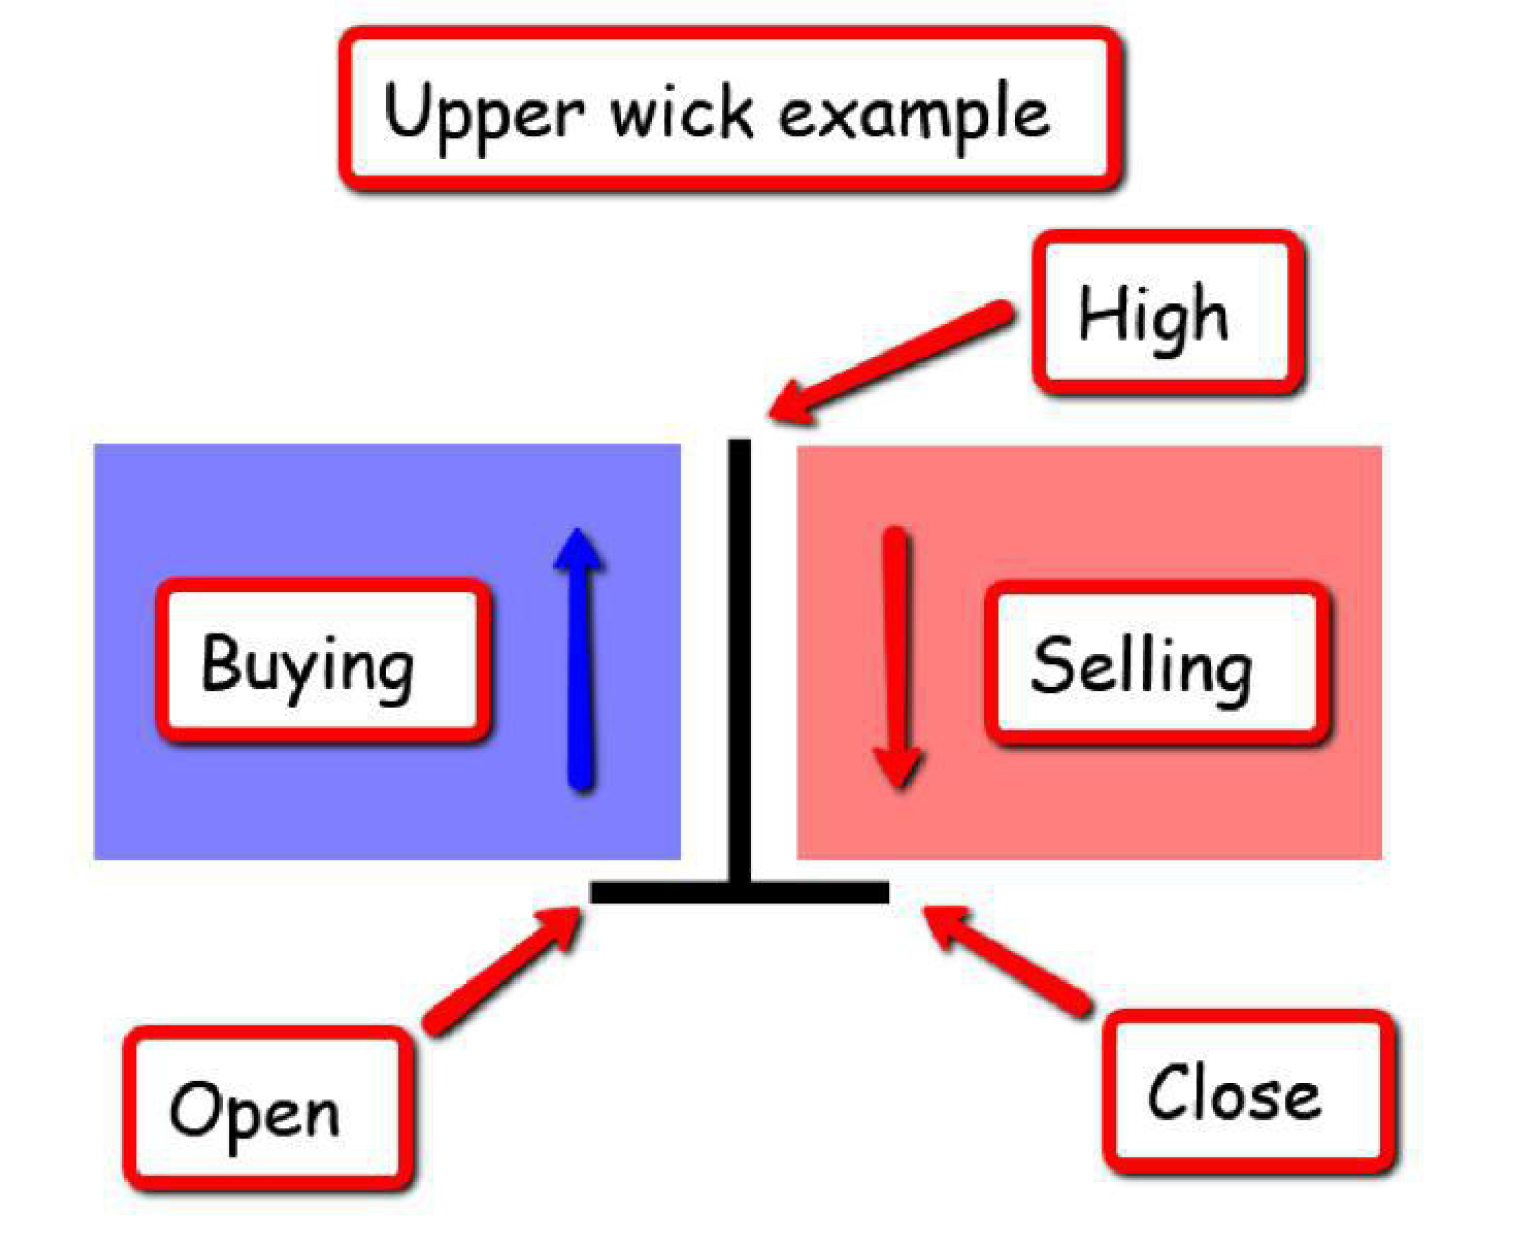
A wide spread between the open and the close indicates strong market sentiment, either bullish or bearish, depending on whether the closing price finished above the opening price or below it.

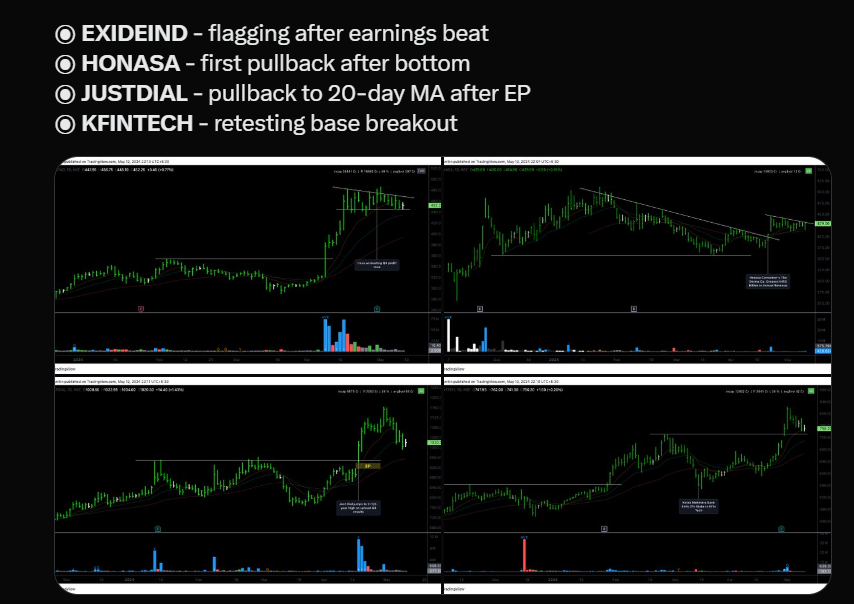



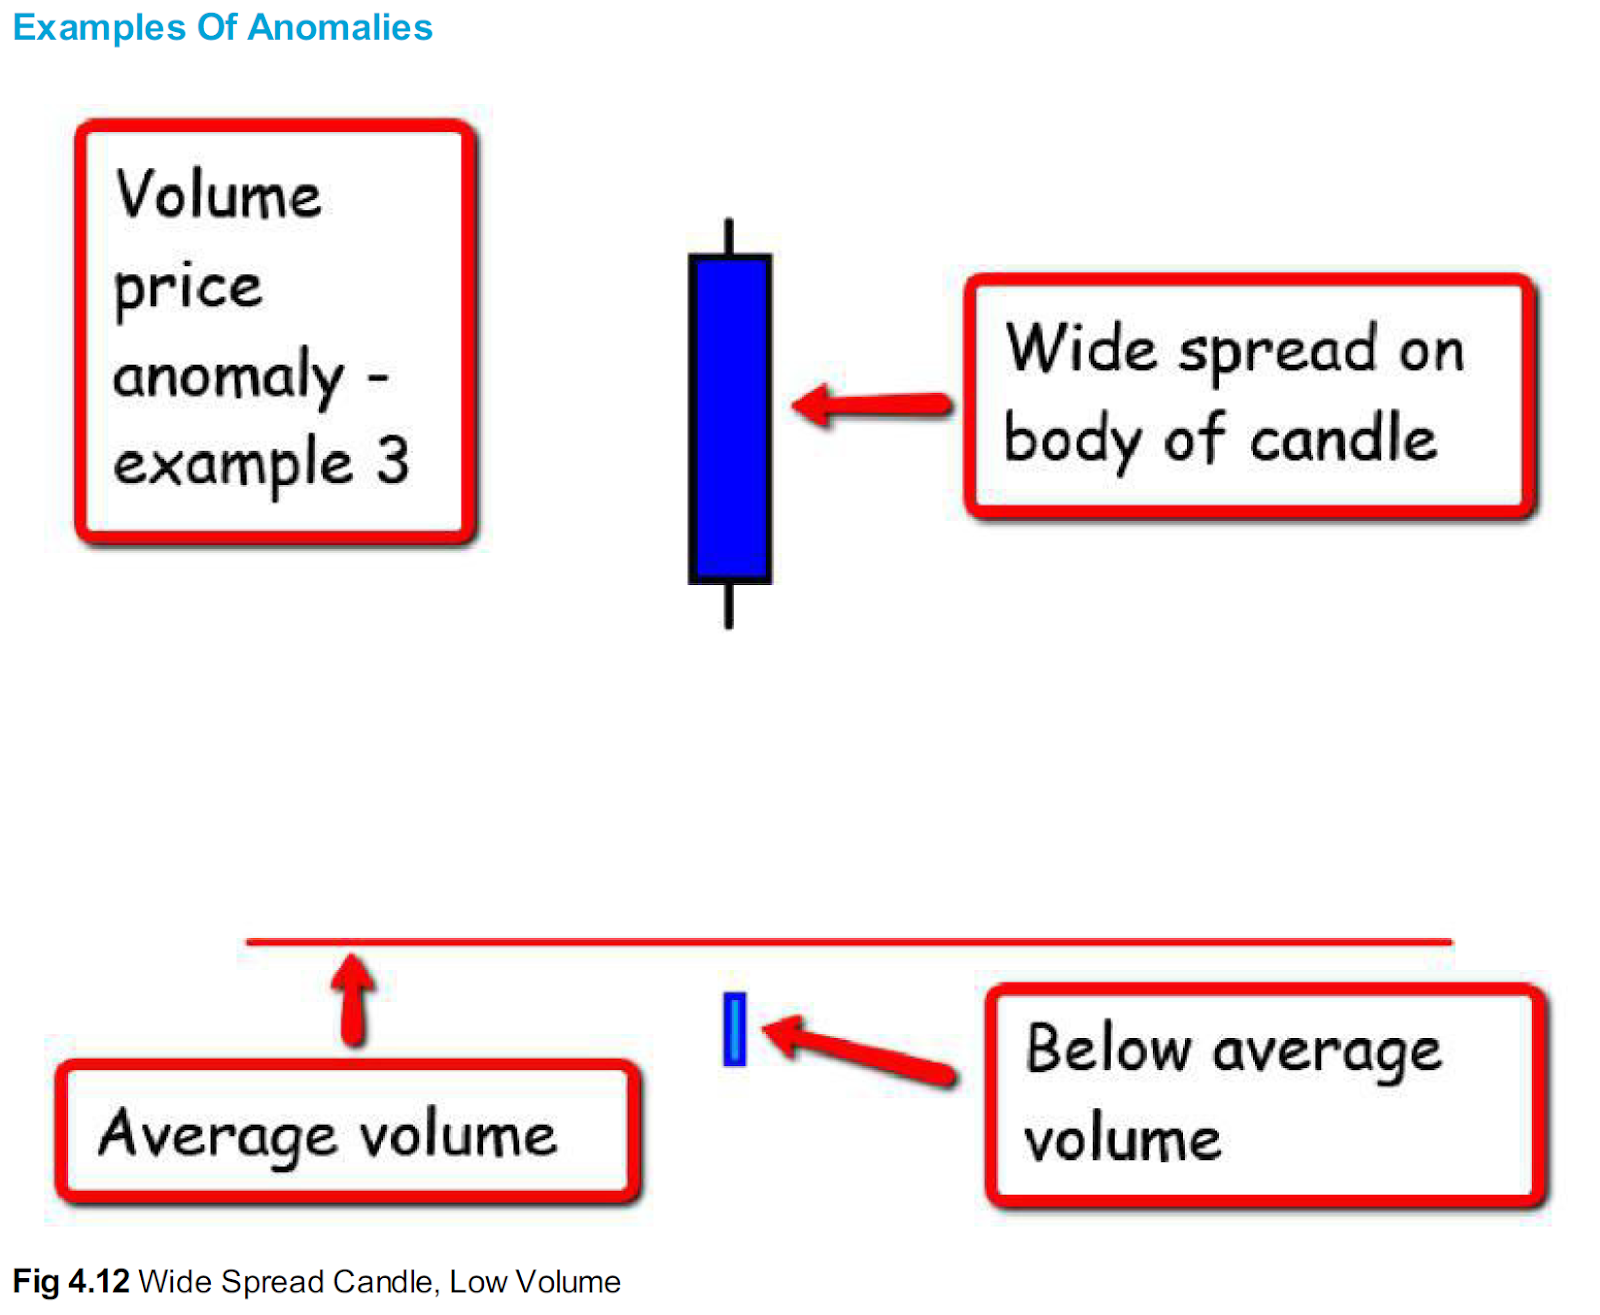


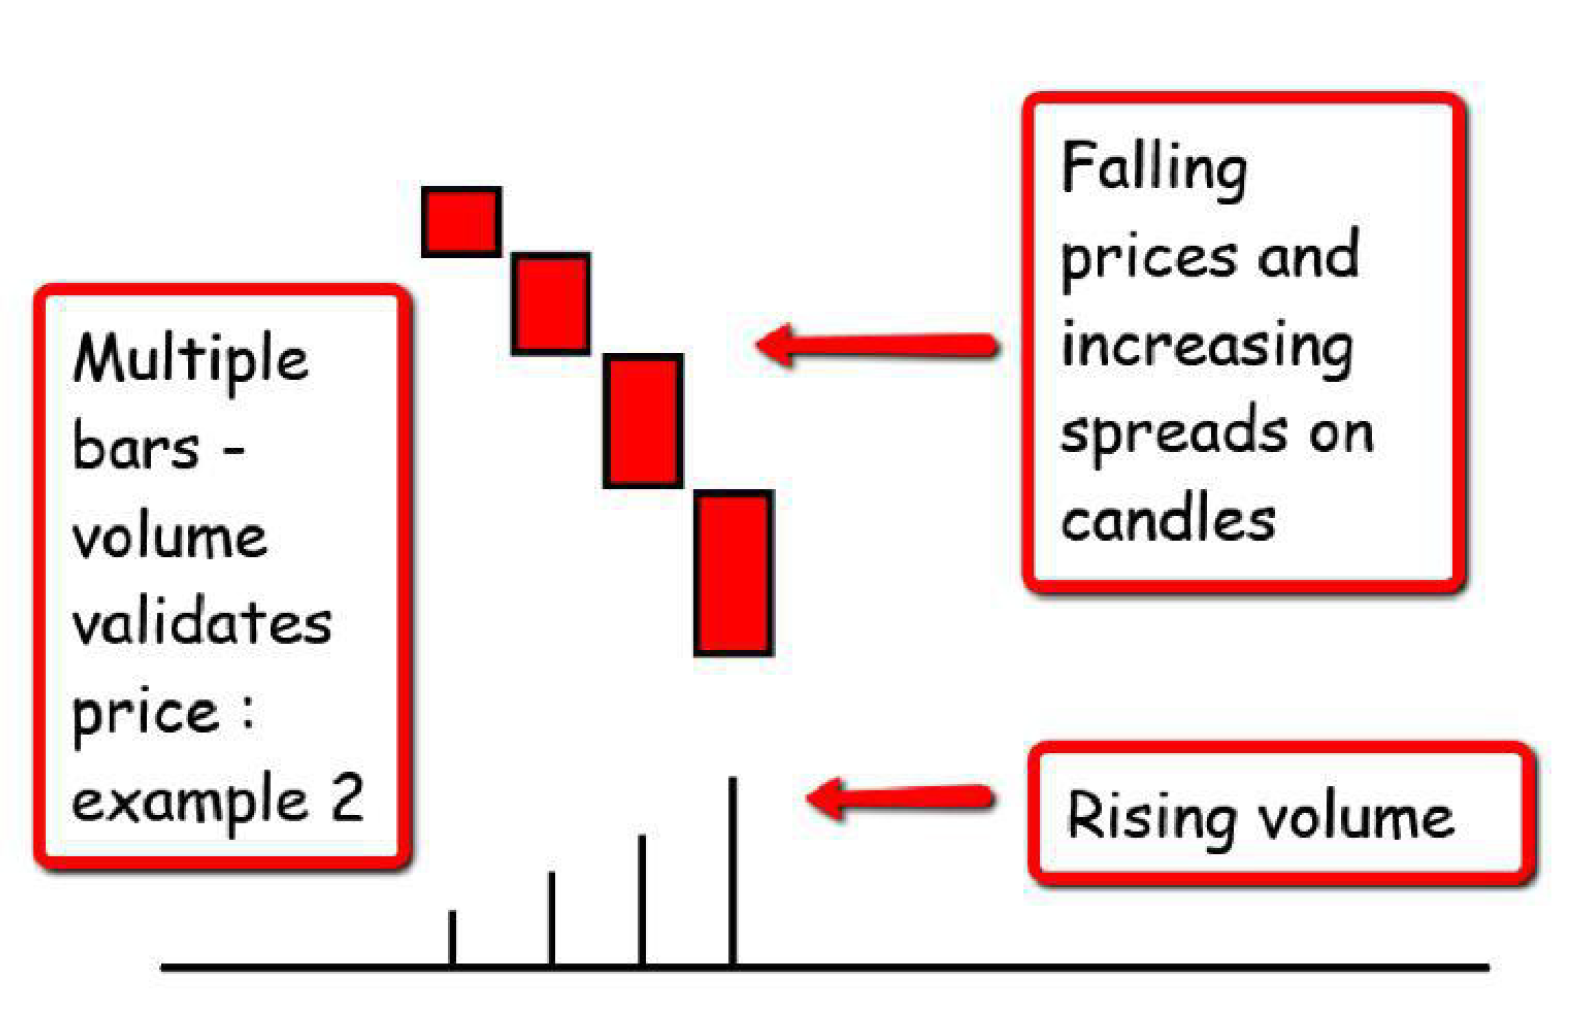

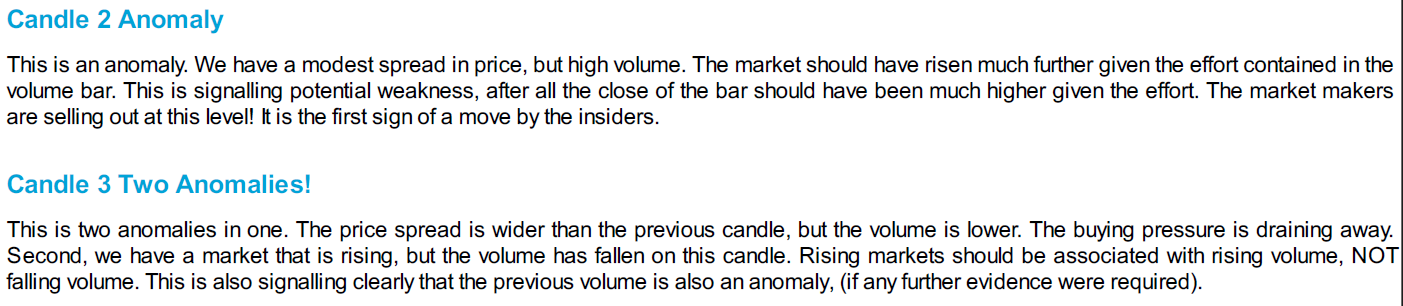
What are the conclusions we can draw from these four candles? The problems start with candle two. Here we have effort, but not an equivalent
result in terms of the associated price action. This is therefore the first sign of possible weakness. The market is what is known as 'over bought'.
The market makers and specialists are starting to struggle here. The sellers are moving into the market sensing an opportunity to short the market.
This creates the resistance to higher prices at this level, which is then confirmed on the third and fourth candles, where volume is falling away



.png)
.png)